Observability
CESSDA IT observability is a business process that collects and analyses data from its infrastructure and leverages that data to improve business results and drive value creation for the organization. Observability of the infrastructure includes:
- CESSDA Core Products
(one of CDC, CVS, EQB, ELSST)
- Infrastructure Management tools, CI/CT process with Jenkins
The observability strategy is made up of three pillars:
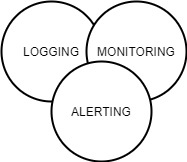
- Logging & aggregation: Logs are detailed records of events that occur within the components or the infrastructure in general. The central logging system collects, aggregates, filters and enriches the contents of the logs and enables visualisation of system and product events, which can aid debugging and problem solving.
- Metrics Monitoring: Metrics represent the raw measurements of resource usage or behaviour that can be observed and collected throughout the infrastructure. The monitoring system collects, exposes, and analyses those values to improve awareness of the characteristics and behaviour of the components the the core products are composed of.
- Alerting: Alerting is the responsive component of the observability system that performs actions based on changes in metrics, threshold violations or/and the occurrence of unacceptable conditions.
Alert notifications are sent via email or dedicated Slack channels, and are based on the following measurements:
- Metrics: generated from the monitoring system when metrics pass thresholds that represent problems occur.
- Logs: generated from the logging system if failures or unacceptable conditions are reported.
- Service Endpoints: generated when internal health checks or external endpoint checks provided by Uptime Robot fail to receive appropriate responses.
- Processes: generated when there are failures in the CI/CT processes.