Logging overview
Terminology
See Naming Conventions.
Introduction
CESSDA follows the recommendation from the Twelve-Factor App on logging which recommends that applications running processes should write their event stream to stdout. In every deployment environment, each process stream should be captured by the execution environment. Each application has a different log stream for the various deployment environments, which is sent to the central logging system. These streams are submitted as a structured logging format, represented as JSON objects.
Logging processes
The CESSDA logging system uses a variation of the Elastic Stack for logging - namely Elasticsearch, Fluent Bit (used as the log router), Graylog and Kibana (EFGK). The log pipeline for CESSDA is as below:
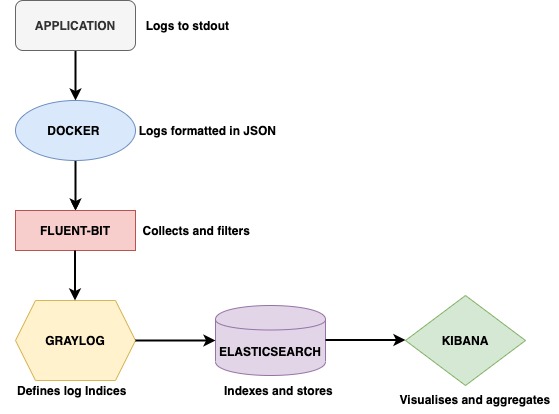
- The application must log each line of the stream to
stdout. - The Docker engine uses the JSON-file log driver to interpret each line as one log event and outputs it as JSON.
- Fluent Bit collects logs and uses Kubernetes Filters to enrich them with Kubernetes metadata.
- Graylog server defines and indexes logs into Elasticsearch.
- Elasticsearch stores log indices for querying.
- Logs are queried, aggregated and visualized with Kibana.
Log levels
CESSDA uses four types of logging levels:
- DEBUG: Fine-grained information about what is going on within the system. This log level is disabled on production systems.
- INFO: Announcements about the normal operation of the system - scheduled jobs running, services starting and stopping, significant user-triggered processes. This log level is disabled on production systems.
- WARN: Any condition that, while not an error in itself, may indicate that the system is running sub-optimally.
- ERROR: A condition that indicates something has gone wrong with the system, representing either a service failure or the inability to carry out a requested task.