Monitoring Overview
Overview
The CESSDA Infrastructure monitoring system is built using the Prometheus stack. Prometheus is an open source monitoring and time series system that collects metrics from agents running on target hosts, storing the collected data on the Prometheus server to be analysed for any system indications. Prometheus is one of the projects of the Cloud Native Computing Foundation (CNCF).
CESSDA’s infrastructure is run and orchestrated by Kubernetes, which makes Prometheus the natural choice for monitoring because its data model mirrors the Kubernetes infrastructure metadata. Also Kubernetes Service Discovery configurations can be read via a REST API and kept synchronized with the cluster state. The monitoring system watches containerized workloads, integrates with Kubernetes and other components in the cloud ecosystem, ingests data, and enables the collection and processing of metrics such as counters, gauges, histograms and summaries.
Metrics gathering
One of the important aspect of monitoring is how the metrics derived for the components in the infrastructure are used. CESSDA relies on two methodologies, USE and RED for determining which metrics to use and for what.
- The Utilization, Saturation and Errors (USE) Method is used for analysing the performance of the infrastructure
- Utilization: the average time that the resource was busy servicing work
- Saturation: the degree to which the resource has extra work which it can’t service, often queued
- Errors: the count of error events
- The Rate, Error and Duration (RED) Method is used to derive user experience metrics, based on the behaviour of a product’s components
- Rate - the number of requests, per second, being served
- Errors - the number of failed requests per second
- Duration - distributions of the amount of time each request takes
Metrics exposure
Infrastructure components and services are instrumented within the Prometheus stack, depending on whether they are customised applications or off-the-shelf tools.
Customised application use client libraries depending on the language the application is written in. CESSDA core products rely on these libraries to define and expose internal metrics (via an HTTP endpoint) to the Prometheus server. Prometheus supports many languages officially such as Java, Go, Python and Ruby. There is also unofficial support for some other programming languages.
Prometheus has plugins or exporters available for some off-the-shelf applications. Some of the CESSDA Infrastructure management tools such as Jenkins and Elasticsearch rely on exporters to expose metrics to Prometheus.
Architecture
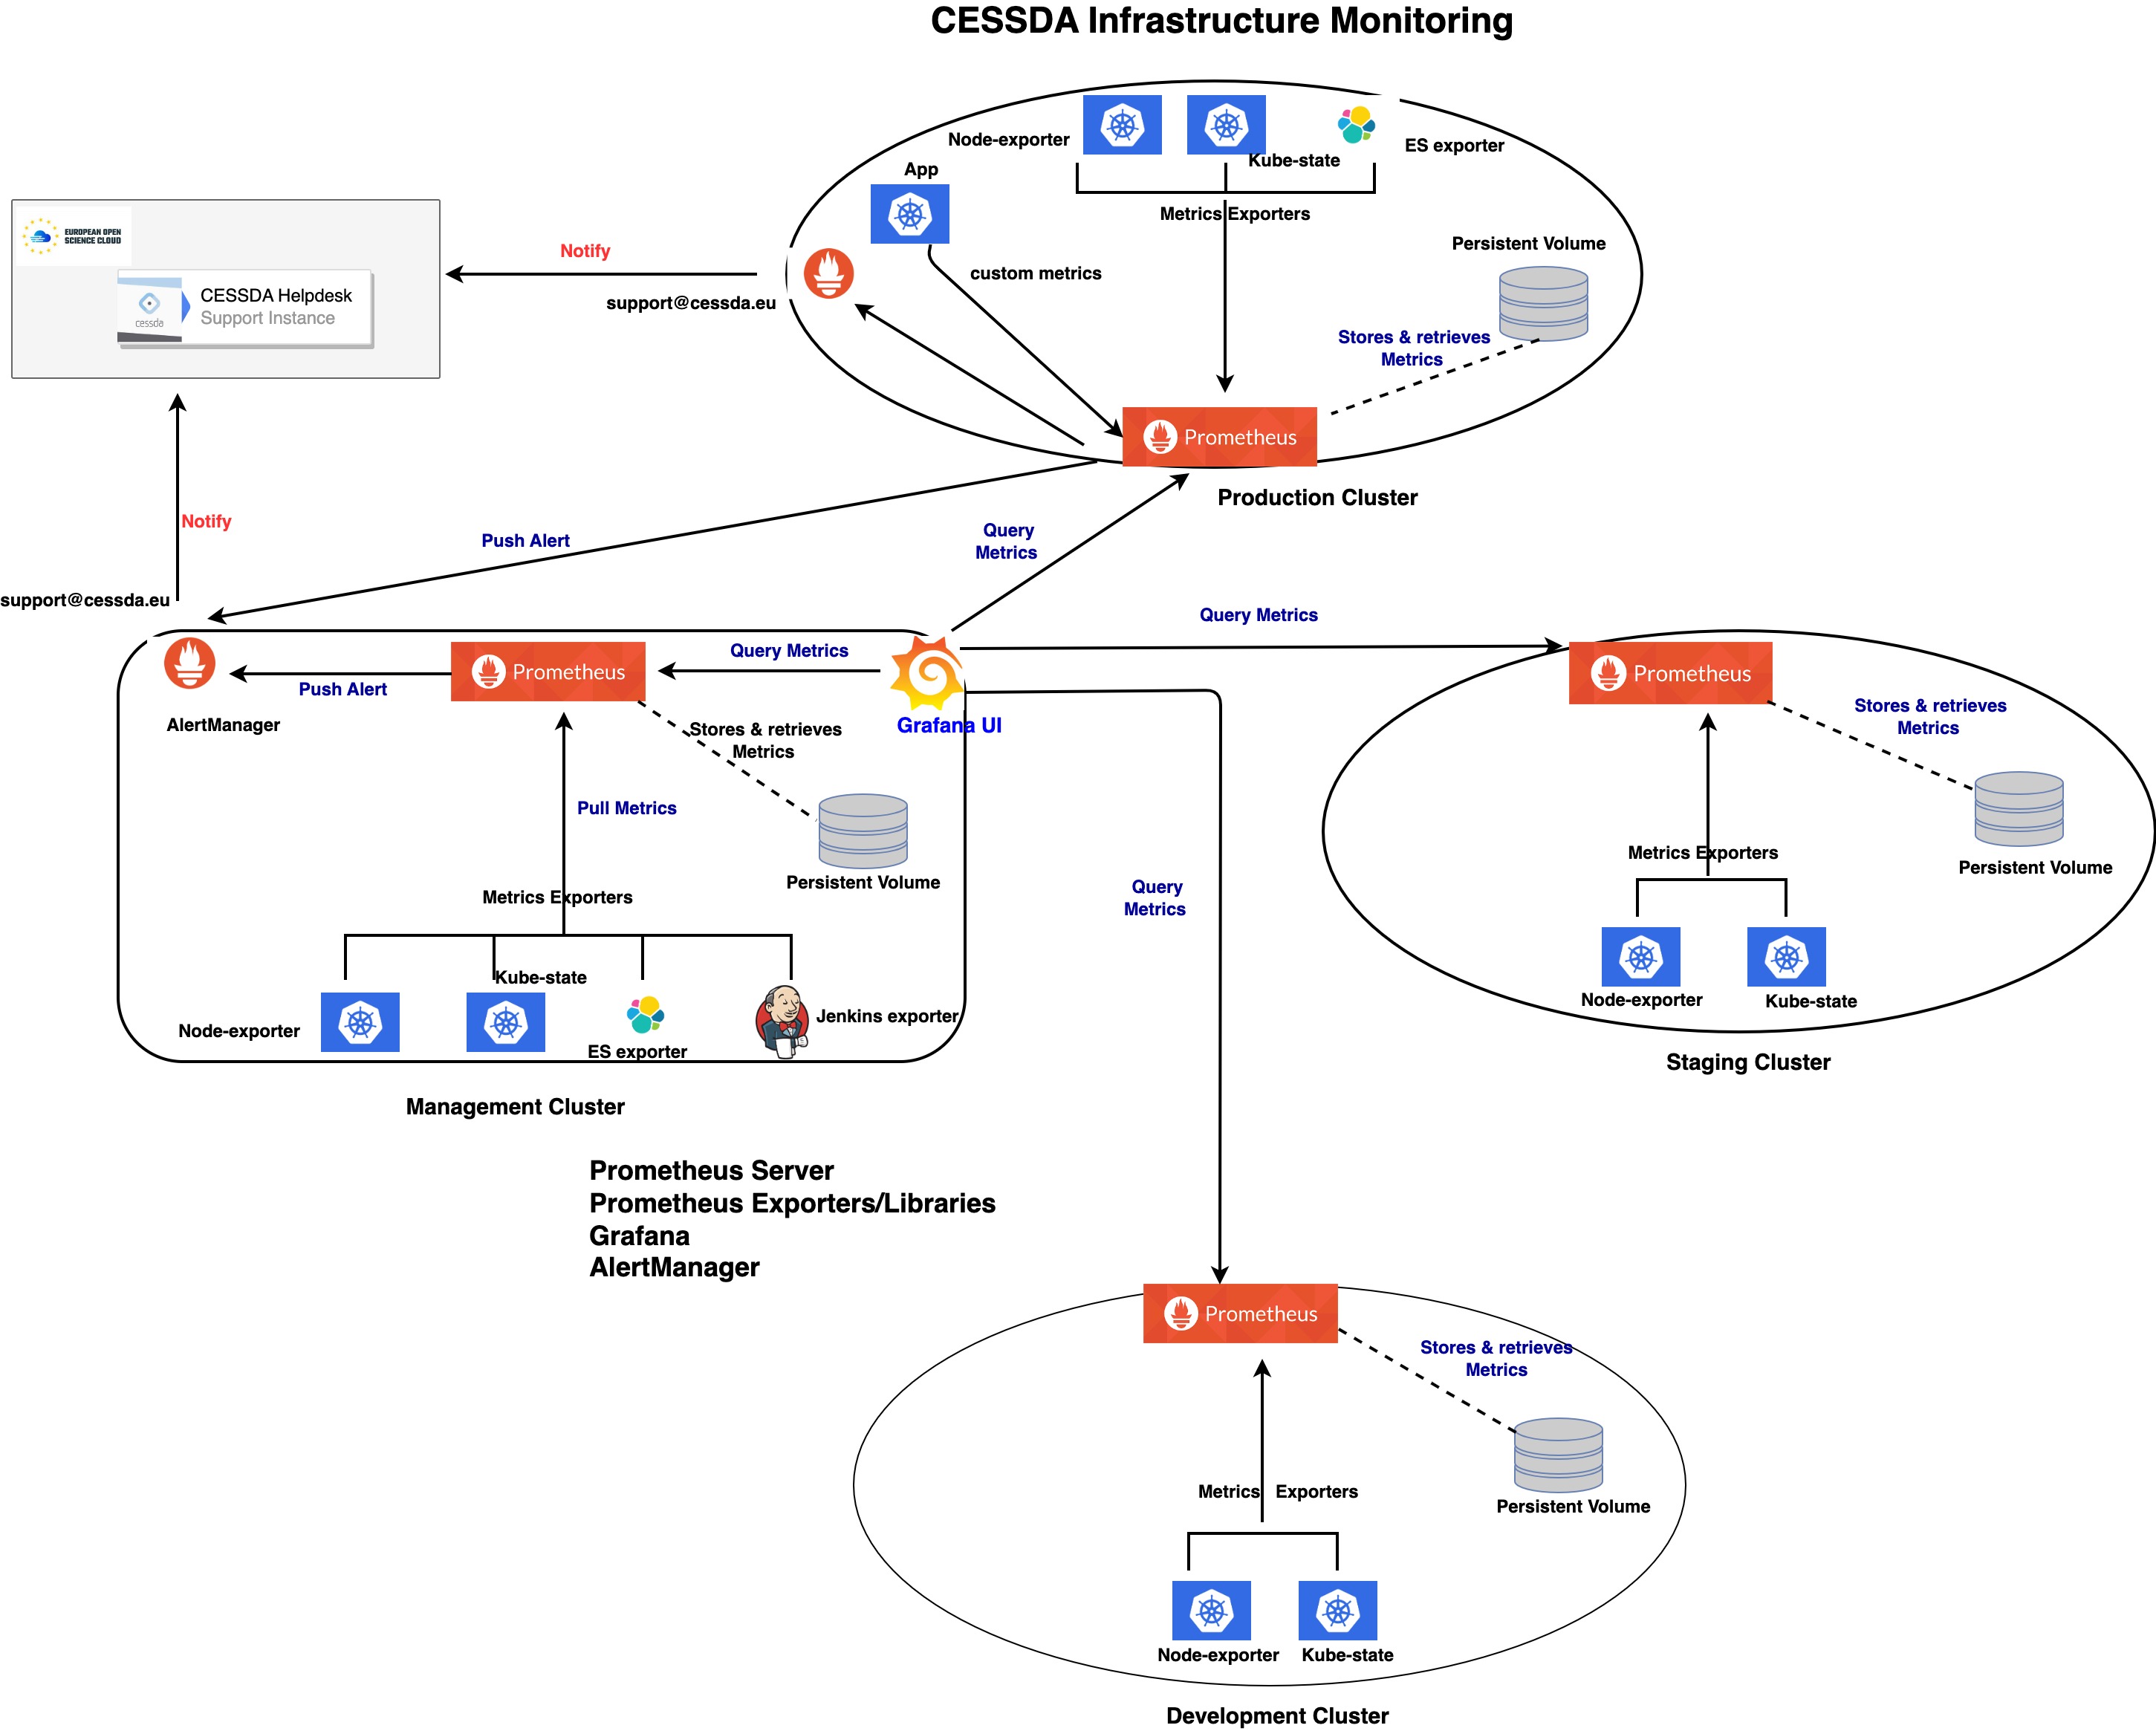
- The monitoring architecture is a Prometheus stack made up of Prometheus server, metrics exporters/client libraries, AlertManager and Grafana.
- The Prometheus server consist of a time series database (
tsdb), a data retrieval agent, and a web server. The data retrieval agent is used to discover targets in Kubernetes and pull metrics from exporters or applications exposed with clients libraries and stored in a time series database. PromQL is a functional query language that is used to select and aggregate time-series data from the Prometheus database. - AlertManager sends notifications, through a specified notification channel, based on alert rules defined in Prometheus operation configurations.
- Grafana receives metrics from Prometheus and is used to create visualisation dashboards for metrics trends and analysis.
CESSDA monitoring composition
- Prometheus servers are installed across the four clusters in the CESSDA infrastructure (management, production, staging and development).
- Node Exporter collects machine-level resource metrics and makes them available for the Prometheus server to store in its time series database.
kube-state-metricscollects cluster-level Kubernetes resource metrics and makes them available for the Prometheus server to store in its time series database.- There are other exporters deployed for third party tools like Jenkins and Elasticsearch, depending on which tools are running in the cluster.
- Alert Manager and Grafana are only deployed on the Management cluster to centrally send alert notifications and visualize and analyse metrics respectively.
- Metrics data stored in a time series database are retained on persistent volumes in the clusters. The retention policy set on Prometheus is based on ensuring that the data does not exceed the available storage space.
A diagram of the monitoring architecture is shown below